
At its core, a sales rep dashboard is your sales team's command centre. It’s a single screen that visually lays out all the crucial sales metrics and performance data, updated in real-time. This isn't just about showing numbers; it's about turning a flood of raw data from all your different tools into clear, actionable insights that a rep can use to guide their day.
Why Your Sales Team Needs a Modern Dashboard
Imagine a sales rep trying to navigate their pipeline without a proper dashboard. It's like a pilot flying through thick fog with just a compass. They might know the general direction they're headed, but they lack the real-time feedback needed to avoid turbulence, adjust course, and land the plane safely and on time. A modern sales rep dashboard is that clear, all-in-one instrument panel.
It pulls everything together—data from your CRM, email interactions, and call logs—into one cohesive, easy-to-read display. Reps no longer have to waste precious selling time digging through different apps to figure out what's going on. Instead, they get a crystal-clear picture of their performance and pipeline at a single glance. That immediate visibility is the bedrock of any data-driven sales culture.
From Data Overload to Actionable Clarity
The real magic of a dashboard isn’t just in displaying figures; it’s about telling a story with that data. It instantly answers the most pressing questions a rep has every single day: Which leads are hot right now? Am I on pace to hit my quota? Why are my deals stalling in the proposal stage?
By turning abstract numbers into visual cues like progress bars, leaderboards, and trend lines, the dashboard makes performance feel tangible. This empowers reps to manage their own activity and keeps them motivated. It also gives sales managers the concrete data they need for coaching sessions that are genuinely productive, rather than just based on a gut feeling. Equipping your team like this is a fundamental part of sales enablement. For a deeper dive, check out our guide on what sales enablement is and how to boost your strategy.
The Power of Real-Time Information
The game-changing feature of any truly modern dashboard is its connection to live, up-to-the-minute information. When a rep closes a deal, logs a call, or books a meeting, they should see that progress reflected on their dashboard immediately. This creates a powerful feedback loop that reinforces good habits and allows for quick course correction when things are going off track.
If you're curious about the mechanics behind this, it's worth understanding What is real-time data and why it's so vital for modern sales teams. This constant flow of fresh information ensures every decision is grounded in the current reality, not on a report that was already stale the moment it was generated.
What Every Great Sales Dashboard Needs: The Essential Metrics
A truly effective sales dashboard isn't just a jumble of charts and graphs. It's a story—a clear, concise narrative about performance. And to tell that story well, you have to track the right metrics. The real magic happens when you create a balanced view that shows not just the final score, but all the plays that led to it.
This means we need to look at two distinct but deeply connected types of metrics. First, you have activity metrics, which are your leading indicators—they measure effort. Then, you have outcome metrics, the lagging indicators that measure actual results. A well-built dashboard weaves both together, giving you the full picture of what’s really going on.
The Foundation: Why Activity Metrics Matter
Think of activity metrics as the building blocks of every sale. They track the day-to-day grind, the hustle, the raw effort your reps are putting in. In the simple "cause and effect" world of sales, these are the causes.
Keeping a close eye on these numbers gives you a real-time pulse on your team's work ethic and strategy. If your results start to slip, the activity metrics are the first place a manager should look. They help you diagnose the root of the problem and provide coaching that actually helps, answering the fundamental question: is the rep putting in the work needed to build a healthy pipeline?
This image breaks down how these foundational metrics build towards the bigger picture on a high-performing sales dashboard.
As you can see, the best dashboards connect the dots, showing a clear line from daily tasks to major sales goals.
In the competitive Canadian B2B scene, for instance, these dashboards are non-negotiable for tuning outbound efforts. Metrics like 'Emails Sent' or 'Calls Made' are direct signals of top-of-funnel activity. This is crucial when you consider that nearly 69% of buyers are still open to taking cold calls. Plus, with 80% of sales requiring between 5 and 12 follow-ups to get a deal done, dashboards are essential for tracking that persistence. You can learn more about these B2B reporting benchmarks.
Common activity metrics you'll want to track include:
- Calls Made: The raw number of dials. A pure and simple measure of effort.
- Emails Sent: How much outreach is happening via email. A great indicator of volume.
- Meetings Booked: A critical one. This shows a rep can successfully turn a conversation into a real appointment.
- Demos Conducted: For many sales teams, this is where the magic happens and the prospect gets to see the solution up close.
The Payoff: Focusing on Outcome Metrics
Hustle is important, but it doesn't keep the lights on. That’s where outcome metrics come in. They measure the tangible results of all that hard work—the lagging indicators that show whether your team's efforts are actually turning into revenue.
These are the numbers that leadership and executives are watching closely. They tell the story of the business's health and ultimately determine if you're hitting your financial targets. They are the final verdict on a sales rep's effectiveness.
Key outcome metrics for your dashboard:
- Quota Attainment: The big one. What percentage of their sales target has a rep hit?
- Win Rate: Of all the opportunities a rep works, what percentage do they actually close? A high win rate points to an efficient and persuasive process.
- Average Deal Size: The average dollar value of each closed deal. This helps you focus on deal quality, not just quantity.
- Sales Cycle Length: How long does it take, on average, to go from first contact to a signed contract? Shorter cycles mean revenue comes in faster.
Bringing It All Together on the Dashboard
The true power of a sales rep dashboard is unlocked when you see these two types of metrics side-by-side. It’s where data turns into actionable insight.
For example, a rep might be making a huge number of calls (great activity) but have a terrible win rate (poor outcome). That instantly tells a manager the rep is putting in the effort but probably needs coaching on their pitch, qualification process, or closing skills.
On the flip side, you might have a rep with a sky-high win rate but very low activity. They're a fantastic closer, but they aren't building a big enough pipeline to keep that success going. The dashboard gives you the hard data needed to have a precise, constructive conversation.
By building this balanced view, your dashboard stops being a simple report card and becomes a strategic guide—a roadmap to success for every single person on your sales team.
To help you get started, here's a breakdown of the most critical metrics you should consider for a modern sales rep dashboard. This table organizes them by category and explains not just what they measure, but why they're so important for understanding and improving performance.
Key Metrics for a Modern Sales Rep Dashboard
table block not supported
By incorporating a mix of these activity and outcome metrics, you create a dashboard that provides a holistic, 360-degree view of performance, enabling reps to self-correct and managers to coach with precision.
Core Features of a Powerful Sales Dashboard
Knowing which metrics to track is one thing, but what really separates a basic report from a game-changing tool are the features baked right into the sales rep dashboard. A truly great dashboard isn't just a static window into your CRM data; it's a dynamic, interactive workspace that actively helps your reps sell more. It goes beyond just displaying numbers to provide crucial context, motivation, and clarity.
Think of it this way: a printed map shows you the general landscape, but a live GPS tells you exactly where you are right now, warns you about traffic jams ahead, and reroutes you on the fly. A powerful sales dashboard does the same thing for a sales rep’s day, guiding them through their pipeline with real-time intelligence.
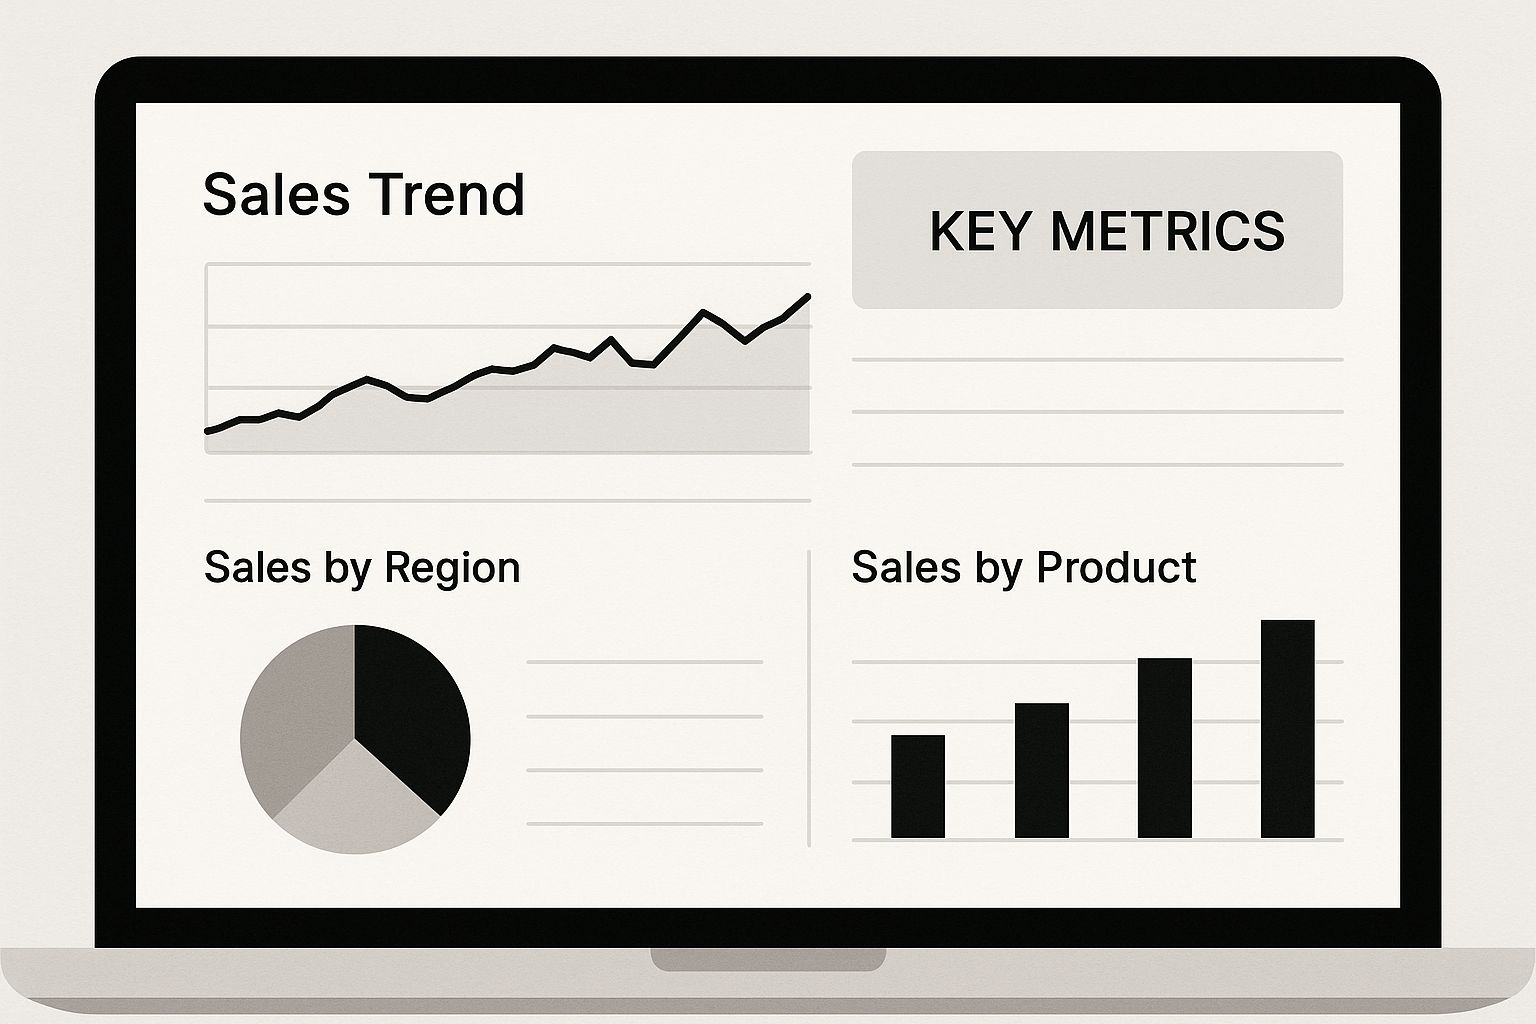
This image shows how a well-designed interface can bring these features to life, making complex data easy to understand and act on in a single glance.

Real-Time Data Synchronization
First things first, the most essential feature is real-time data synchronization. When a rep logs a call, sends a critical email, or moves a deal to the next stage, that change needs to show up on their dashboard instantly. A dashboard that only updates once a day isn't a performance tool; it's a history book.
This immediate feedback loop is a massive motivator. It validates a rep's effort the moment it happens and lets them see the direct impact of their actions throughout the day. This keeps momentum high and empowers them to make small, continuous adjustments to stay on track.
Customizable Views for Different Roles
A one-size-fits-all dashboard just doesn’t cut it in a modern sales organization. A Sales Development Rep (SDR) and an Account Executive (AE) have entirely different day-to-day priorities, and their dashboards should reflect that. A powerful platform allows for deep, role-based customization.
- For SDRs: The view needs to be laser-focused on top-of-funnel activities. Think widgets for dials made, conversations logged, and meetings booked.
- For AEs: Their focus shifts to managing the pipeline and closing deals. Their dashboard would highlight metrics like win rate, average deal size, and quota attainment.
- For Managers: A manager’s view aggregates team-wide data, showing leaderboards, overall pipeline health, and flagging reps who might need a bit of coaching.
This level of customization cuts through the noise and ensures every person sees the most relevant information for their specific role, helping them focus on what will actually drive their success.
Goal Pacing and Gamification
Let’s be honest, most people are visual. Seeing progress toward a goal is a huge motivator, and the best sales dashboards lean into this with elements that make performance tracking intuitive and even a little bit fun.
Goal-pacing visuals—like progress bars that fill up, gauges, or burn-down charts—give reps an instant read on where they stand against their daily, weekly, or monthly targets. There's a real sense of accomplishment in watching that bar fill up, and it naturally encourages them to push just a little harder to close the gap.
On top of that, features like leaderboards tap directly into the competitive nature of most sales teams. Showcasing the top performers for key metrics like meetings booked or revenue closed can spark a bit of friendly competition that lifts everyone's game. To get a feel for different layouts, it can be helpful to check out these effective sales performance dashboard examples. These elements transform the dashboard from a simple reporting tool into an engaging part of the daily sales workflow.
Driving Better Coaching and Forecasting with Dashboards
Beyond helping an individual salesperson, a well-built sales rep dashboard is one of the most powerful tools a sales manager can have. It fundamentally changes the manager's job from putting out fires to proactively coaching for performance. Instead of waiting until the end of the quarter to see what went wrong, managers can use live data to steer their team toward success, day in and day out.
This is where the dashboard connects the dots between a rep's daily grind and the company's bigger strategic goals. It delivers the clarity managers need for two of their most crucial responsibilities: targeted coaching and accurate revenue forecasting.
Transforming Coaching from Guesswork to Guidance
Good sales coaching isn't about spouting clichés like "just make more calls." It’s about zeroing in on specific behaviours that are holding a rep back. A sales dashboard gives you the objective proof you need to make these conversations pointed and genuinely helpful.
Think about it. A manager pulls up a rep’s dashboard and sees a ton of activity—calls are being made, emails are flying out—but their conversion rate is stuck in the mud. Right away, that data tells a story: the problem isn't effort, it's effectiveness.
This insight lets the manager pivot the conversation from a generic pep talk to a surgical diagnosis. The discussion can then get into the nitty-gritty:
- Pitch Refinement: Is the rep’s opening falling flat?
- Qualification Process: Are they wasting cycles on leads that were never going to buy?
- Objection Handling: Are they fumbling when they get a bit of pushback?
When you coach this way, you build a culture of constant improvement. Reps start to see their manager not just as a boss checking boxes, but as a strategic partner who’s invested in making them better.
Achieving Crystal-Clear Revenue Forecasting
Let’s be honest, accurate forecasting is a huge headache for most sales leaders. It’s often a messy blend of a rep’s gut feelings and historical data that might not even apply anymore. A sales rep dashboard cleans all of that up by rolling up real-time team data into one reliable snapshot of the entire pipeline.
By tracking metrics like total pipeline value, average deal size, and sales cycle length for the whole team, managers get a much clearer picture of what’s likely to close and when. It’s a far more dependable system than just banking on individual optimism.
For instance, a quick glance at the dashboard can show you if the team's pipeline is dangerously thin at the top or if a bunch of deals are getting bottlenecked in the final stages. These insights allow managers to take action before it's too late, whether that means launching a new prospecting blitz or jumping in to help get stalled deals across the finish line.
The role of a sales rep dashboard in California, for example, is vital for linking a team's activity directly to revenue outcomes. By keeping an eye on the team's 'average quota attainment percentage,' managers get a weekly forecast of sales health. This is critical, especially when you consider that an estimated 84% of reps missed their quotas last year. For sales leaders, catching problems early isn't a luxury; it's a necessity. You can see how top sales teams use dashboard examples to get these kinds of insights.
Ultimately, a great dashboard becomes the source of truth for the sales organisation. Reps are accountable for their numbers, and managers have the big-picture data to confidently predict future revenue. This alignment gets everyone on the same page, driving toward the same goals with real clarity.
How to Choose and Implement the Right Dashboard

Picking a new tool for your sales stack can feel like a huge task, but a little structure can turn a tough choice into a game-changing move. The trick to choosing the right sales rep dashboard isn't about finding the software with the most bells and whistles. It’s about finding the one that fits into your team’s daily rhythm like it was made for them.
The whole point is to give your team a boost, not to saddle them with a complicated tool that just sits there gathering digital dust.
So where do you begin? Start with your people. Before you even think about watching a single demo, get your top performers and your newest hires in a room. Ask them what info they wish they had at their fingertips and what tasks eat up most of their time. Their answers are pure gold—they'll give you a practical checklist of "must-have" features that solve real problems.
Key Evaluation Criteria for Your Next Dashboard
As you start looking at different platforms, you need to cut through the marketing fluff. Focusing on a few core areas will help you find a tool that delivers real value and that your team will actually want to use from day one.
1. Seamless CRM Integration This is non-negotiable. Your dashboard has to talk to your Customer Relationship Management (CRM) system perfectly. We're talking deep, two-way sync, where an update in one place instantly shows up in the other. If your reps have to manually enter data, you’ve already lost.
2. Intuitive User Experience (UX) Sales reps are wired to sell, not to be data analysts. The dashboard needs to be clean, simple, and visually intuitive. Here’s a good rule of thumb: if a rep can't grasp their progress towards a goal within five seconds, the design is a failure.
3. Scalability and Customisation The tool you pick today has to be ready for where your team will be tomorrow. It must handle more data and more users without grinding to a halt. It also needs to be flexible, allowing you to create custom views for different roles—what an SDR needs to see is completely different from what a sales manager or an Account Executive requires.
A Practical Roadmap for Successful Implementation
Once you’ve found the right dashboard, how you roll it out is just as important as the tool itself. A rushed launch can create pushback, but a thoughtful one builds excitement and gets everyone on board.
Here’s a simple four-step plan to get it right:
- Define Your Core KPIs: Start small and focused. Pinpoint the three to five most critical metrics for each sales role and build the first dashboards around them. You can always add more later.
- Secure Team Buy-In: Position the dashboard as a tool for personal success, not a "big brother" management tool. Show your reps exactly how it helps them track commissions, close more deals, and smash their targets. This is a vital part of effective sales operations planning.
- Conduct Hands-On Training: Run training sessions that mirror your team's real-world workflows. Show them how to use the dashboard to prep for the day, check progress on a live deal, and review their own performance.
- Integrate and Iterate: Weave the dashboard into your sales culture. It should be front and centre in team meetings and one-on-one coaching sessions. After the first month, ask for feedback and be ready to tweak things based on what your team finds most helpful.